This is a chart detailing some of the statistics I have accumulated over the past 40 years. On this website is information on every wreck included in these numbers.
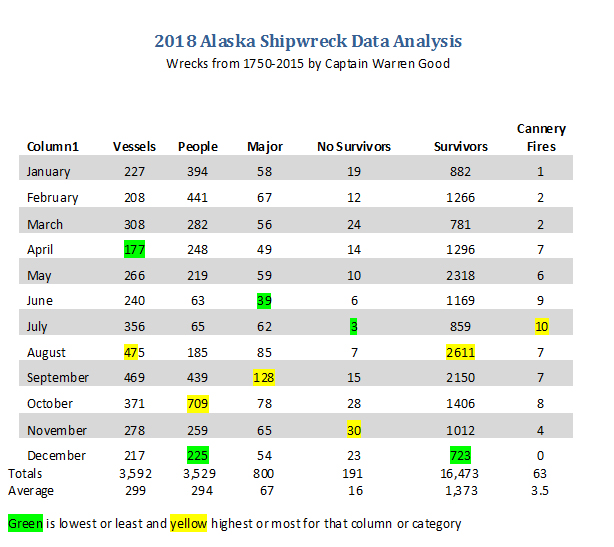
A Comprehensive Accounting of Alaska Shipwrecks and Losses of Life in Alaskan Waters
This is a chart detailing some of the statistics I have accumulated over the past 40 years. On this website is information on every wreck included in these numbers.
Comments are closed.
Hi Warren,
This is really interesting and impressive that you’ve compiled all these data.
Have you made any regional maps with points for all the wrecks? I’d love to make an interactive map for Southeast Alaska.
Best,
John
I have my office walls covered in NOAA Charts with many of the wrecks mapped but the digital representation of all the wrecks is still in the works. At present I am involved in a project dividing the wrecks into the waterways in which they took place. For example, in the Southeast Alaska section, I have segregated all 1000 or so shipwrecks into Wrecks of Clarence Strait, Wrecks of Chatham Strait, Wrecks of Frederick Sound etc. Poet and Marine Historian Michael Burwell is helping me research the wrecks we already have (around 3,800) and add others that present themselves. Do you have some experience with working on digital maps? I have not decided which digital mapping media is best for the purposes of this shipwreck archive. The longitude and latitude I have been putting with most wrecks represents the geographical feature used to report the wrecks. If a wreck report states that a vessel sank off Shipwreck Point, I use the longitude and latitude of Shipwreck Point. The purpose of this work is not to direct people to the location of shipwrecks. What I am more interested in is drawing attention to the circumstances of shipwrecks and the dangers that are constantly destroying vessels and lives. If you know how to make an interactive map, I would be interested though. Contact me at warren@alaskashipwreck.com and maybe we can talk about it.